Aller directement au contenu
Retour à la page d'accueil
SUD éducation
Vaucluse
Site de l'Union Syndicale Solidaires
L'Union Syndicale
Site de la fédération SUD éducation
La fédération
SUD éducation Vaucluse
Membre de la fédération SUD éducation
Menu
Accueil
SUD éduc 84 ?
Qui sommes-nous ?
Statuts
Transparence
Agenda militant interne
Vos droits
Premier degré
Second degré
Supérieur
Le droit syndical
Participer à une grève
Participer à une formation
Participer à la vie du syndicat
Actualité et Publications
Mobilisations
Premier degré
Second degré
AESH-AED
Supérieur
Compte-rendu des instances
Brochures pour se former
Formations & Réunions d’Information Syndicale
Contact
Contacter le syndicat
Contact presse
Adhésion
Recherche
Entrez les termes de votre recherche
SUD éducation Vaucluse - Accueil
1er mai, manif 10h00 à Avignon, Cours Jean Jaurès
1er mai, manif 10h00 à Avignon, Cours Jean Jaurès
Jeux coopératifs, stage de formation syndicale
Jeux coopératifs, stage de formation syndicale
« NON » au « Choc des savoirs » : ensemble nous disons,
« NON » au « Choc des savoirs » : ensemble nous disons,
Publié le
21/04/2024
Jeux coopératifs, stage de formation syndicale
Publié le
20/04/2024
1er mai, manif 10h00 à Avignon, Cours Jean Jaurès
Publié le
11/04/2024
Cessez le feu et levée du blocus immédiats !
Publié le
30/03/2024
En grève le 2 avril Non au choc des [...]
Publié le
28/03/2024
Manifestation samedi 30 mars, 17h00, Avignon : Journée de [...]
Publié le
06/03/2024
Marche pour un cessez-le-feu et la paix
Publié le
24/02/2024
Journée internationale de lutte pour les droits des [...]
Publié le
24/02/2024
Salaires, postes, moyens : en grève dès le 19 mars !
Publié le
24/02/2024
Marche pour la paix, la justice et un [...]
Publié le
17/02/2024
« NON » au « Choc des savoirs » : ensemble nous disons, [...]
Publié le
16/02/2024
CSA Académique du 9 février 2024 – Déclaration liminaire.
Publié le
16/02/2024
AESH – Abus sur les heures connexes…
Publié le
08/02/2024
Marche pour la paix, la justice et un [...]
Publié le
25/01/2024
Marche pour la paix, la justice et un [...]
Publié le
10/01/2024
Marche pour la paix, la justice et un [...]
Publié le
10/01/2024
Rassemblement jeudi 11 janvier, 18h30 contre les violences [...]
À retrouver sur le site fédéral
Guide
Guide sur le remplacement dans le premier degré
Guide
Guide du RDV de carrière – PPCR
Guide
Les congés liés à la parentalité
Guide
Les droits à congés pour maladie (non-imputable au service) (CMO – [...]
Guide
Guide des accompagnant‑e‑s d’élèves en situation de handicap
Tous les guides
Les derniers tracts
Tract
La lutte continue : en grève le 3 octobre ! AESH, un métier, [...]
Tract
6 juin
Tract
On continue pour le retrait !
Tract
Nous allons gagner !
Tract
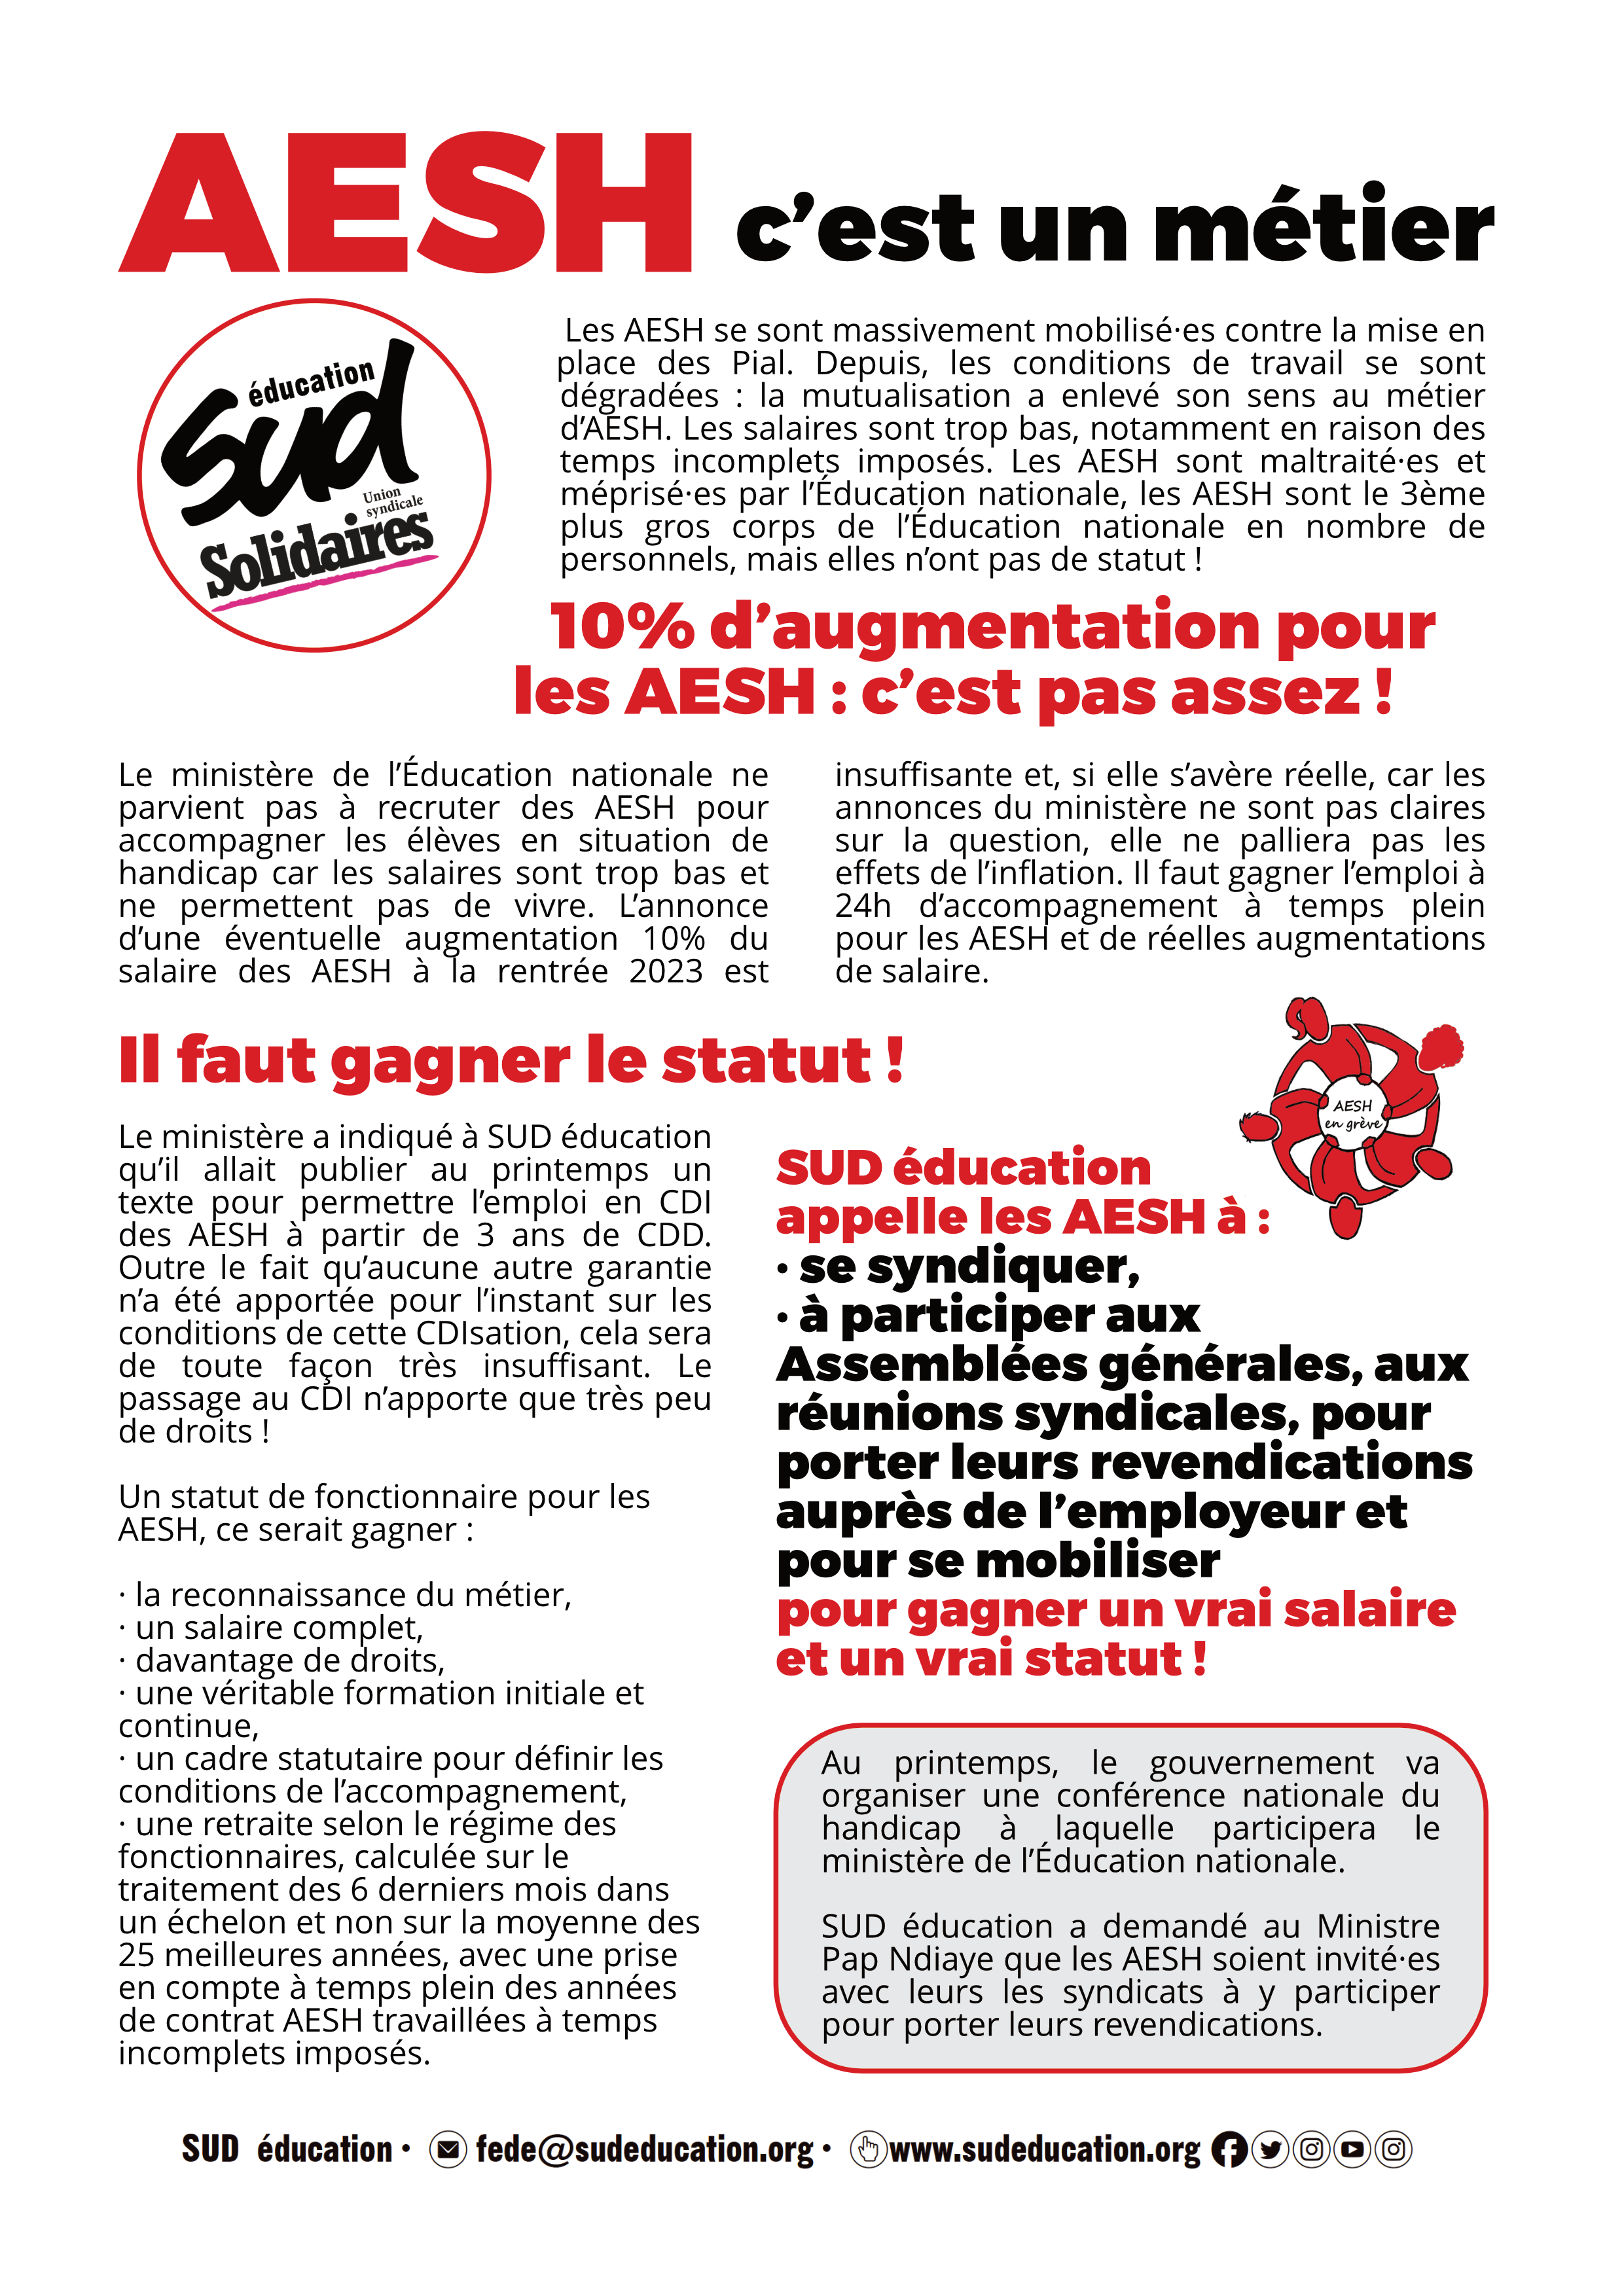
AESH, c’est un métier !
Tract
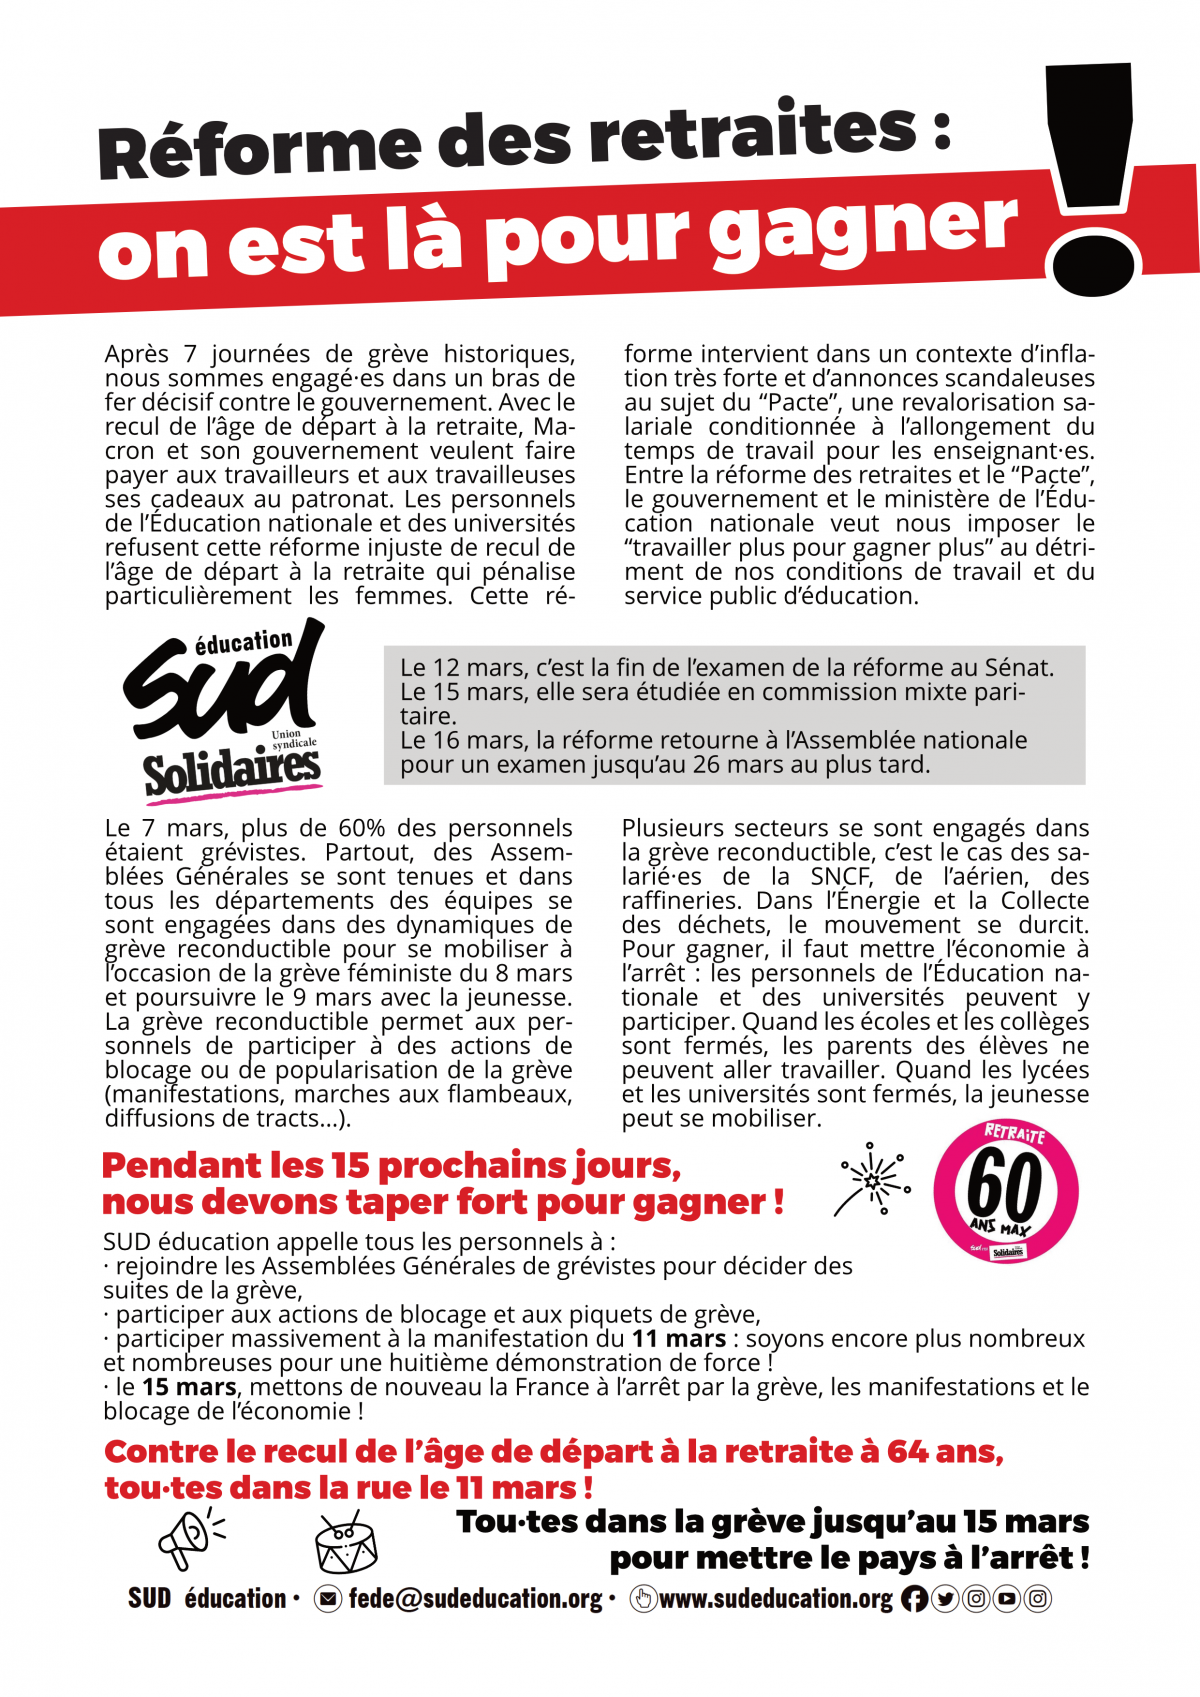
Réforme des retraites : on est là pour gagner !